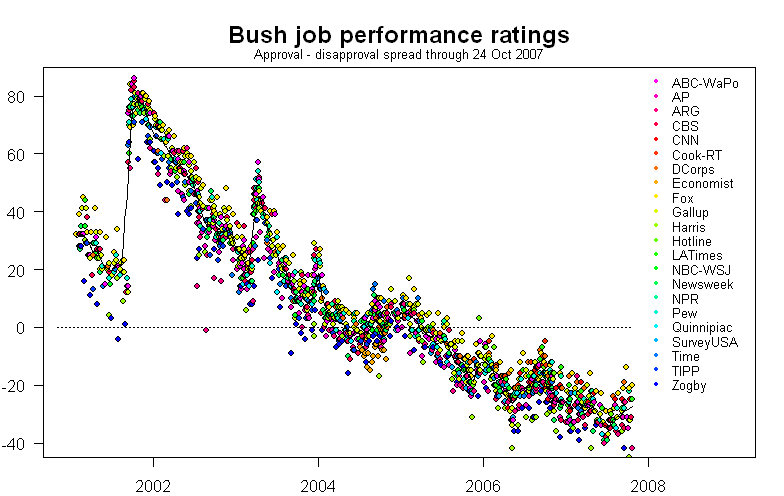
Here is the trend in President Bush's job performance rating since the beginning of his term in office, as reported by more than a dozen national polling firms:
Others have already commented on the striking pattern, but I am interested in a different question: do some polls "lean" in one direction?
The answer is yes. It appears that some polls consistently tend to favor one side of the trend line or the other; for example, Zogby polls tend to fall below the trend line while Fox polls tend to fall above it. Here is the same plot as above, with the Zogby and Fox polls highlighted:

This type of lean by different polling houses is often referred to as a house effect. Each of the following panels shows the net approval (i.e., the approval-disapproval spread) for each of the main polling firms during the President's term in office. Superimposed on the net approval is an overall trend line. As you may be able to see, some polls (among them, Gallup, Fox, and ABC) tend to run above the trend line while others (among them, Zogby, Harris, and AP) tend to run below. The panels are listed in decreasing order of the number of polls—this is done to emphasize that patterns at the bottom of the graphic should be taken with larger grains of salt than those at the top.

An alternative presentation of the data that focuses on the difference between the polls and the trend line may make is easier to see the house effects. That is called a residual plot, and you can see the accompanying residual plot here. In each of those panels look at whether the mass of points generally lies above, below, or is centered directly on the dashed horizontal line.
Above I highlighted the difference in President Bush's job performance as reported by the Fox and Zogby polls. Below is a set of panels that show President Clinton's job performance as reported by different polling firms. Note that just as the Fox polls now appear to favor President Bush, they then favored President Clinton; just as the Zogby polls now appear to disfavor President Bush, they then disfavored President Clinton. It appears that the Fox and Zogby polls consistently tend to favor or disfavor the incumbent (compared to other polls) no matter what his political affiliation may be.

These systematic house effects can be large — in fact, they can be larger than the nominal "margin of error" that is reported along with every poll. What causes house effects? I look at some of the possible explanations here, which is a more detailed comparison of systematic lean in both Presidential approval and head-to-head election polls for the 2004 election. In particular, note that the Zogby, Harris, and AP polls present their "job approval" questions differently than the other houses: they offer respondents a slightly wider choice of answers than a simple "approve" or "disapprove." There are also differences in the sample and the average amount of "undecideds" by polling house: Fox polls survey registered voters (most other polls survey "adults") and they tend to have slightly higher numbers of undecideds.
The plots above show net approval (that is, approval minus disapproval) but when the newspapers report the President's approval ratings, they usually report only gross (that is, just the approval rating without subtracting the disapproval). What is the difference? A large part of the difference among polls is in the proportion of "undecided" or "don't know" or "decline-to-state". For example, the Fox poll tends toward high proportions of undecideds while the Zogby poll tends toward low proportions. When the proportion of undecideds varies greatly between two polls, the gross approval doesn't tell the whole story. For example, in the first few weeks of his administration, President Bush had an approval rating of 46% on the Fox poll -- but 40% of respondents were undecided and only 14% reported disapproval. Contrast this the Fox poll shortly before Hurricane Katrina, when his approval rating was 45%, but he had only 5% undecided and a disapproval rating of 50%. Gross approval was quite close in these two cases (46% vs. 45%) but no one would say that they represented the public's perception of the President equally well. In the earlier poll, the President's net approval was 46% - 14% = +32%; in the later poll, his net approval was 45% - 50% = -5%.
To see the difference between gross and net approval over the last 12 months place the mouse pointer over the image below; then move the mouse pointer away to return to gross approval. In each panel the black line shows what the trend would have been without that firm's polls. This gives a rough idea of how much each firm's polls influences the overall trend, both in gross and net approval.

The data underlying these graphs can be found on the publicly-accessible pages at Pollingreport.com and the Roper Center for Public Opinion Research.
