As the November 2004 election nears, new polling results get released almost every day. Many people have been using these polls to make predictions of the election outcome. I focus on a more basic question that may influence those predictions: do some polls consistently lean one way or the other? This type of lean by different polling houses is often referred to as a "house effect." I look at two different kinds of polls and find that some polls do show systematic bias, and make an estimate of its size and direction. The systematic bias between polling houses can be larger than the reported "margin of error."
The last data point from my head-to-head election poll was 30 Oct 2004. My weighted-and-bias-adjusted estimate showed the President Bush with a gap over Senator Kerry on that date of 1.9%. The final election results showed a 2.5% difference between the President and the Senator at the national level.
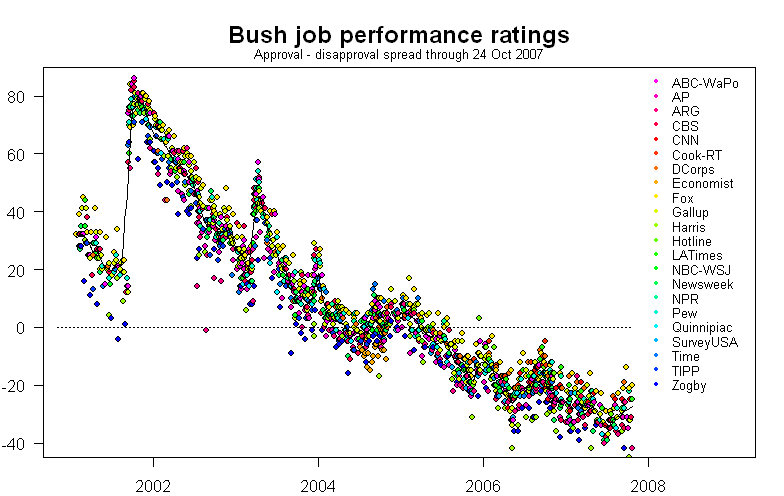
Here is the trend in President Bush's job performance rating since the beginning of his term:

Others have already commented on the striking pattern, but I am interested in a different question: do some polls "lean" in one direction?
The answer is yes. It appears that some polls consistently tend to favor one side of the trend line or the other; for example, Zogby polls tend to fall below the trend line while Fox polls tend to fall above it. Here is the same plot as above, with the Zogby and Fox polls highlighted:

At this point we point out that we're using lean in comparison to the average of all polls: perhaps the Zogby poll is "straight" and the others are the leaners, or the Fox poll is straight and the others lean. In either case, it is clear that the Zogby and Fox polls differ from each other and do so in consistent directions. So, keeping that in mind, are there other polls that lean and, if so, do all polls from the same polling firm show the same lean? This type of lean by different polling houses is often referred to as a "house effect."
Because Presidential job approval polls are often thought to be a reasonably good predictor for the Presidential election results, let's focus on those two types of polls.
First, here's the job approval graph again, but zoomed-in only on the period since January 2004:

Now, here's a similar graph showing the trend in the Bush vs. Kerry head-to-head election polls, also since January 2004:

(The graph above shows the spread between Bush and Kerry; if you want to see the trend in the actual levels, click here).
If you examine the two graphs closely you'll see that the picture is more complex: some polls do seem to fall consistently on the same side of the trend lines but others do not. I calculated the average amount that each poll differs from the trend lines on job approval and the election over the last four months, and show the results in the table below--a positive number means the poll's average was above the trend (and thus, tended to lean toward the President) while a negative number means the poll's average was below the trend (and leaned away from the President). Keep in mind that this summary is sorted by the number of polls taken during the last four months; you should therefore take the results at the bottom of the table with an even larger grain of salt than those at the top.
|
It may be hard to see overall patterns from the table so its information is displayed in the graph below. It makes clearer that a polling firm can appear on one side of the trend on the President's job performance yet appear on the other side on the election, i.e., leaning one way on one of the questions doesn't mean that the polling firm leans the same way (or the same amount) on the other question. Taking into account the number of polls, can you see which ones tend to lean the most?

Some polls do seem to lean consistently one way or the other. I don't know why they lean the way they do; I'm just pointing out that they do. The amount and direction of lean, however, needn't be the same for job approval and election trial heats. Note that the spread of bias on the job approval question appears to be quite a bit larger than the spread across the election--much larger than the nominal MoE (margin of error) reported by each pollster. This means that there are differences between polls that are due not to sampling error but rather to systematic patterns in the way the polls are conducted. You may wish to keep this in mind if you follow state-by-state projections of electoral votes based on these or other polls (such as here or here): simple summaries of recent polls, without taking into account underlying bias patterns, may be a less reliable indicator of the voters' intent than you think.
Here is the pedantic and off-putting version that explains how the trend line is calculated, discusses the role of "undecideds," and briefly touches on differences between "likely voter" and "registered voter" polls.
