Elsewhere I address the question, "How good could the Ciclosport HAC4 be at measuring power?" The Ciclosport HAC4 is essentially an altimeter which calculates power by speed, elevation change, rider weight, and some guesses about aerodynamic drag.
The other side of that analysis is, "How good can a power meter be at estimating elevation gain?"
Using Gary Gellin's SRM data from his 2002 and 2003 San Bruno Hillclimb races (which rise about 1200 feet in about 3.6 miles), and some simplifying assumptions about his weight, aero drag, and acceleration, I solved to get the elevation gain. I got one estimate using his 2002 data and another using his 2003 data. A comparison of the two can be seen here:

I've never done this climb so I don't know if these two profiles realistically show the flat spots and steep pitches, but it's interesting to see that they are consistent across the two years. The difference in estimated elevation gain between the two estimates is about 8%, and since Gary's overall power was pretty comparable across the two years (and we think geologic processes work slowly enough that the hill's profile didn't change much in the intervening period), one can think of the difference as roughly due to aerodynamic or windspeed differences.
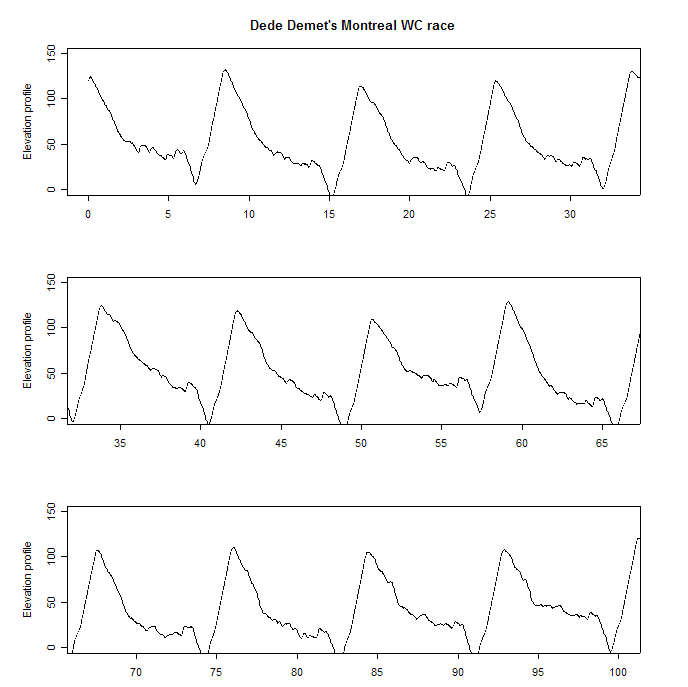
Here's another, more complex, example based on Dede Demet's 2002 Montreal World Cup win (from the Power Tap website). In this case, I do not know what the actual elevation was, or the windspeed, or wind direction, but I do know that the 100km, 3-hour long course was a loop that climbed the same hill twelve times. If you were to look only at the power data it would be difficult to identify the beginning of each loop (I know, I've tried). On the other hand, simply by backsolving for the elevation gain, one can identify the start of each lap to within 20 or 30 meters (the laps appear to be 8.43km long, with all calculated lap lengths falling between 8.40 and 8.46km). However, "tuning" the parameters of the calculation is still a bit tricky. The most sensitive parameter is her CdA of which we know little. Nonetheless, knowing that the top of each hill was the same height, we can estimate what her CdA should have been in order to get the hills to approximately match up.
Note that this approach differs from the usual appproach of rearranging the power equation to solve for CdA -- in that case, you must already know the slope. In this case, we solve for cumulative elevation gain (and loss) over a series of laps over the same course. By looking at the cumulated gain over the same laps, we have essentially controlled for differences in windspeed and rolling resistance (as long as they do not vary in a systematic way from lap to lap) and magnify the sensitivity of the resulting equation to average CdA, which is then the tuning parameter of focus. Note, too, that the tuning parameter is average CdA, so it can't easily be used to check for differences in positioning. Under certain tedious testing conditions, one could actually use this method to estimate actual average CdA rather than just changes in CdA; however, the tediousness of this method would appear to make this impractical.
It turns out that these data are best approximated by using two distinct estimates of CdA, one for the first 30 km of the race and one for the remaining 70km (the estimate for the first 30km is lower, which could either indicate that the wind was blowing differently or that she was riding in a more sheltered position, or both). Below is a graph that shows the calculated elevation profile based on power data, with the upper panel based on the "low" CdA value and the bottom two on the "high" CdA. Although the profiles for each lap do not line up exactly and windspeed and wind direction are completely ignored, the overall impression is that similar features show up in approximately the same place each time. I was surprised.
The two examples above were based on data collected from an SRM and a Power Tap, and cannot be validated since there is no altimetric data against which to compare. However, Kraig Willett recorded a climb of Palomar Mountain (in Southern California) with a Polar S710 with both power unit and altimeter (in fact, he climbed it with all three power systems installed: the Polar, the SRM, and the Power Tap. A link to his comparison can be found on the main page). Here is a graph that compares the profile of the climb using his altimetric data with my calculations based on power data.
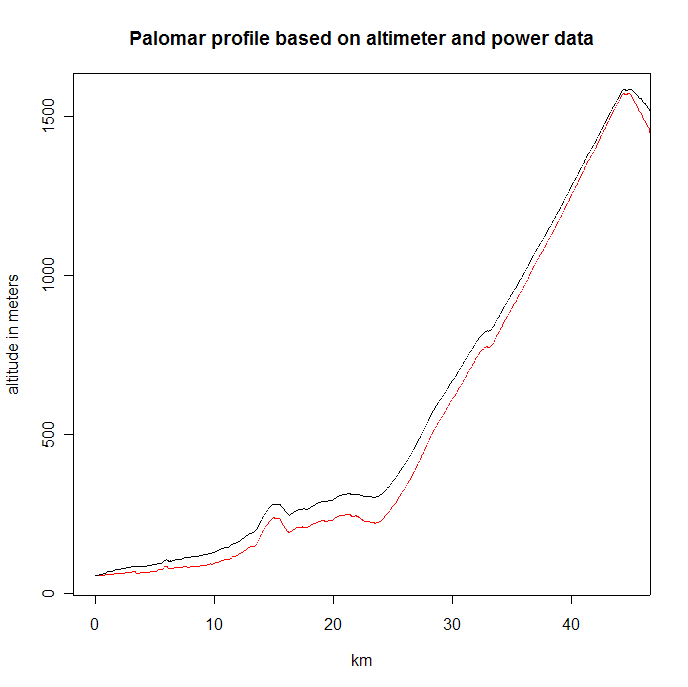
Can you identify which line is based on the recorded altimetric data, and which on the calculation? I think the real answer is that it doesn't matter. The two are amazingly close. To be fair, I should admit that this graph was chopped off at the top of the climb--if you had seen the entire profile including descent, the difference would be obvious.
My conclusion? The next time someone asks me how good the HAC4 could be at measuring power, I'll say it's about as good as using a powermeter to estimate altitude gain.