One of the first things people do when presented with power data is to plot them. However, since power is the product of pedal force and pedal speed (or equivalently, torque and angular velocity) it may be equally interesting to decompose power into its two separate components and to compare power with each of them.
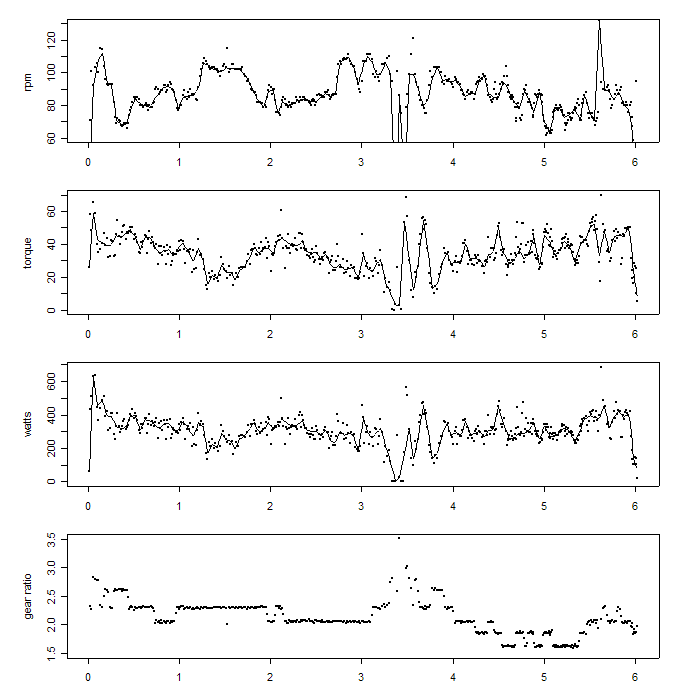
I have plotted the components of power from Gary Gellin's 2003 San Bruno Hillclimb. The plots below show (by distance in kilometers) cadence (in rpm), average torque over a single crank revolution (in newton-meters), and power (in watts). I have superimposed a slightly smoothed line onto the plots to help show the overall pattern. In addition, because gear usage influences cadence and torque, I have also included that plot. Perhaps you will be able to discern that in these data power appears to track crank torque (and thus, pedal force) more closely than cadence. Note in particular the sections from about kilometer 1 to kilometer 2, and again from about kilometer 2.1 to about kilometer 3.0, during which the gears were constant. Over those two sections, Gary's cadence varied from a low of about 80rpm up to more than 100rpm.
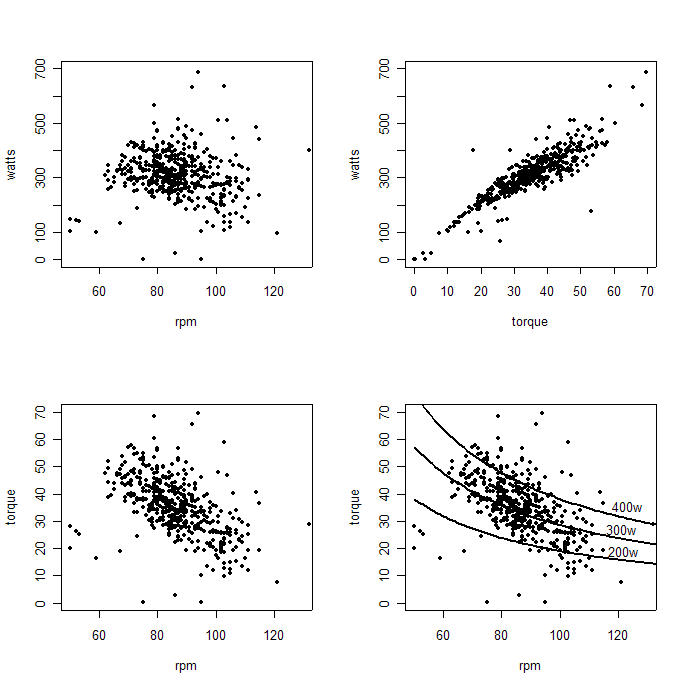
Below are four additional plots. The upper left scatterplot shows the relationship between power and cadence; the upper right shows the relationship between power and crank torque; and the lower left shows the relationship between the two components. The lower right plot superimposes three "isopower" contours on the rpm-torque plot at the lower left and its signficance will be explained in the section below. Evidently, the linear correlation between power and torque is higher (r = 0.9) than that between power and cadence (r = 0.03 if we exclude zero power readings, which essentially means no linear relationship). Note also that the correlation between cadence and torque is moderately high and negative (r = -0.4, once again excluding zero power readings), so that in general the higher the cadence the lower is the torque.
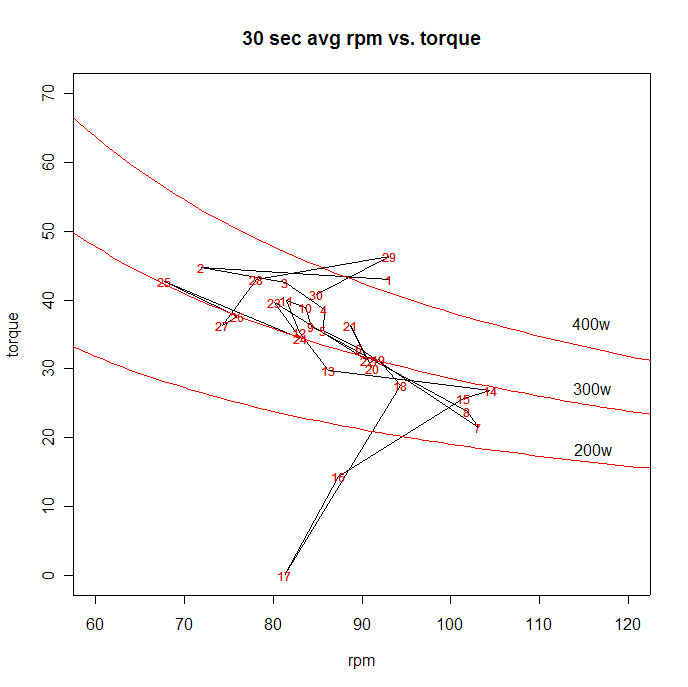
Although the correlation between cadence and torque is obvious, each point in the bivariate panel plot above shows individual observations, and does not link the points in sequence (as the plots at the top of this page do). The plot below shows the time-sequence of the cadence-torque relationship, smoothed over 30-second intervals. If you follow the path of the line from 1 to 30, you can trace the cadence-torque combinations Gary used during the climb that day. Below that is a supplementary plot that shows the gear choice during the climb, with each 30-second interval keyed to the numbers in the cadence-torque plot. For example, you can see that intervals 6, 7, 8, and 9 were done in the same gear.

You will often hear or read people theorizing about the relationship between power and cadence, seeking a "sweet spot" where power is maximized. These graphs show that in large part that search is a dead end. In simple terms, they are thinking about power as if it were a function only of cadence when we know by definition that power is a function both of cadence and torque. These plots show that under certain circumstances power can be much more responsive to small changes in torque than to small changes in cadence. In addition, there is a trade-off between torque and cadence (which is what the bottom left plot in the panel above shows). By ignoring torque and focusing only on cadence people are ignoring half of the two components of power. What determines the amount of torque at a given cadence? Mostly, the gear ratio (and wheel size). One cannot talk about power and cadence without talking about either torque or gear ratio.
In other words, since we know that power is the product of cadence and torque (or pedal speed and pedal force), looking for a relationship between power and cadence without taking into account torque is like looking for a relationship between the area of a rectangle and its height without taking into account its length. Worse, suppose that although some rectangles are slightly shorter and some slightly taller, they all lie within a narrow range of height (just as most cadences lie within a narrow range of each other). You will be able to plot the rectangle area against the rectangle height, just as one is able to plot power against cadence, and you will find a particular height for which your particular sample of rectangles has the largest area. It does not follow that rectangles of that height will always have the largest area, nor that that height represents a "sweet spot" for rectangle area.
Some coaches recommend that cyclists train at high(er) cadences both to decrease force on the joints and to increase power. Perhaps decreasing forces on the joints may be its own aim, and there may truly be some cadence-limited cyclists whose power will be improved by this type of exercise but, in the main, I would think that the relevance of high-cadence low-torque (=low power) training to high-cadence high-torque (=high power) riding is not well-supported by these data. Part of the reason can be seen in the lower right panel above, where isopower contours have been overlaid on the torque-rpm plot. Each isopower contour shows the combination of cadence and torque that is necessary to produce a certain level of power: the three lines show the combinations needed for 200 watts, 300 watts, and 400 watts. The lines slope downward, but of more importance is that the general relationship between torque and cadence slopes downward even more steeply. This suggests that, except at very low cadences and very high torques, an exogenous increase in cadence is associated with a more than proportional decrease in torque, thus leading to lower power.
Does this mean that one shouldn't train for high cadence? Not necessarily. However, I believe it does mean that coaches shouldn't simply say to "ride at cadence X"; if they do choose to recommend cadence work, they should say "ride at cadence X and torque (or wattage) Y."
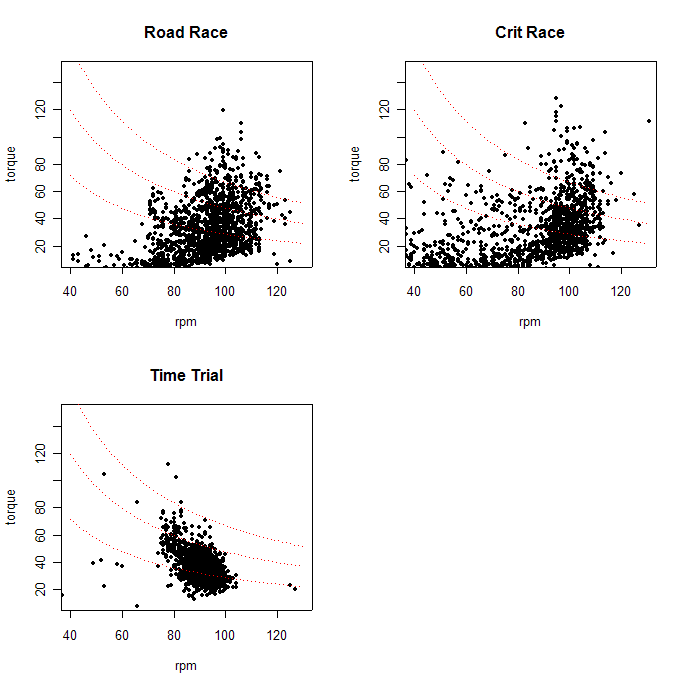
No. Just as it is wrong to think of power being determined mostly by cadence, it would be equally wrong to think of power as being determined mostly by torque. In addition, the cadence-torque relationship will vary depending on the type of race. The plots below show the cadence-torque relationship on the same scale for the same rider (but not the same rider as for the hillclimb data above, alas) on three different types of races: a road race, a crit, and a TT. The thin red lines show power at 300, 500, and 700 watts (the TT was a bit less than one hour in length, so to make the number of observations about equal, I arbitrarily and randomly selected about an hour's worth of data from the road race and the crit). Even a quick glance shows that different kinds of rides can be characterized by very different patterns of torque and cadence. If one takes the pattern from Gary Gellin's hillclimb race as typical of hillclimbs (and I've found this to be roughly so for other data from hillclimbs), then you may start to understand why people who advocate raising the front end of their wind trainers by a couple of inches to simulate climbing may be inadequately capturing true climbing efforts.
A pointer to the data used here, or other data sets you may wish to investigate, can be found via the link below.