We have already seen much discussion of the problems in trying to relate HR to power. Here's a related issue: problems in looking at the relationship between cadence and power.
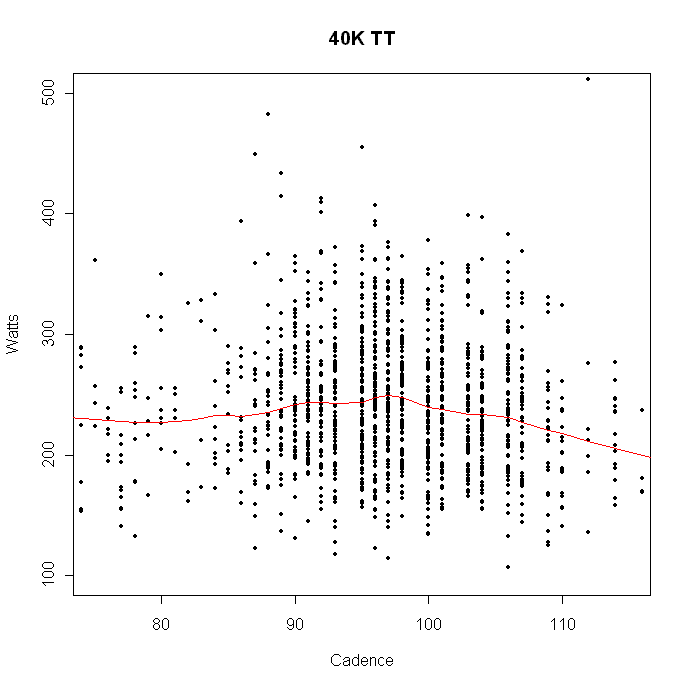
Here's an example of a plot of power vs. cadence, taken from a data file collected during a 40K TT. Superimposed on the data is a smooth line in red that shows the average power output at each level of cadence. The line shows that on this particular ride the rider averaged slightly more power at 97rpm than at other cadences. (By the way, these data were collected from a Power Tap, and it was these data that alerted me to the cadence "holes" that occur at 94, 99, and 102 rpm which forms part of a PT "fingerprint.")
This may seem reasonable, and you may be tempted to think that 97rpm is the optimal cadence for this rider. However, the rider didnĺt quite achieve his goal of breaking an hour for the 40K.
Hereĺs moral #1:
The plot tells you what the rider did, not what he should do.
Itĺs like looking at your credit card statement at the end of the month--it tells you where you spent your money, not where you should have spent your money. If he wants to break an hour, maybe he should spend more of his time riding at 97rpm--but maybe not. This plot wonĺt tell you what he should do, but maybe you still think that 97rpm is a good place to start. Is it?
Letĺs look at another plot. This rider did some hill intervals using a Polar S710. Once again I have superimposed a smooth line that shows the average power at each cadence level. You can see that although the rider spent a majority of time at relatively high cadences, his power average was actually highest at lower cadences. On the other hand, thereĺs a broad plateau from about the high 80ĺs up to the low 100ĺs.
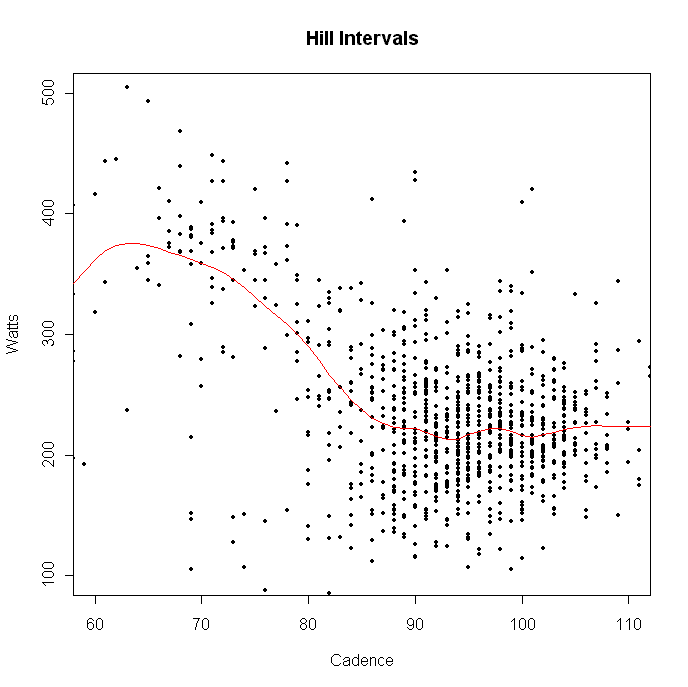
In the section above you may have thought that even if 97rpm wasnĺt exactly optimal for that rider it was still a good place to start. In this plot, you see a rider whose maximal average power looks like it was being generated at around 65rpm. Would you recommend that this rider spend more of his time at 65rpm? What's going on? Click here to see.
Hereĺs moral #2:
Cadence is a response to the demands of riding.
What is it about cadence-power plots that you may not have taken into account? See components of power.
People who like to do things for themselves or who are suspicious that I have manipulated the data or the graphs (and you know who you are) will want to analyze these data themselves. The two data files used for these plots can be found here as a single 29kb zipped file.