One of the first questions asked about on-bike power meters is "which device is most accurate?" In June 2002, Adam Hodges Myerson went for a two-and-a-half hour ride on a bike simultaneously outfitted with three power-measuring devices: a SRM Amateur crank, a Power Tap hub, and a Polar S710 chain-sensor. Strictly speaking, these data do not address accuracy since there are no externally-calibrated measurements against which to compare. However, these data can address consistency of the devices. I do not discuss usability, reliability, features, or installation of these devices, topics on which others have focused. I focus solely on the data reported by each.
Here is a tabular summary of the wattages recorded during the ride:
Mean |
25%tile |
Median |
75%tile |
Maximum |
% zero watt readings |
Mean of non-zero readings |
|
Polar (5sec) |
149.3 |
105 |
152 |
200 |
530 |
17 |
180.2 |
Power Tap (2.52sec) |
136.9 |
81 |
134 |
184 |
693 |
13 |
160.0 |
SRM (2sec) |
147.8 |
83 |
144 |
201 |
746 |
11 |
166.7 |
The mean wattages are quite close, particularly the Polar and the SRM. However, this table also demonstrates that although mean wattages across the three devices may be similar, the overall distribution of wattages needn't be. Note that the Polar S710 data were recorded at 5-second intervals, the Power Tap at 2.52 seconds (but see below), the SRM at 2 seconds. A longer recording interval will tend to depress max wattage readings, but my a priori guess would have been that it would also reduce the proportion of data points of zero wattage. This appears not to be the case.
Tables have their place, but often graphs can give a more complete idea of how well or poorly these devices track each other. A graph of the raw and unsmoothed wattage recorded by each device can be seen here:
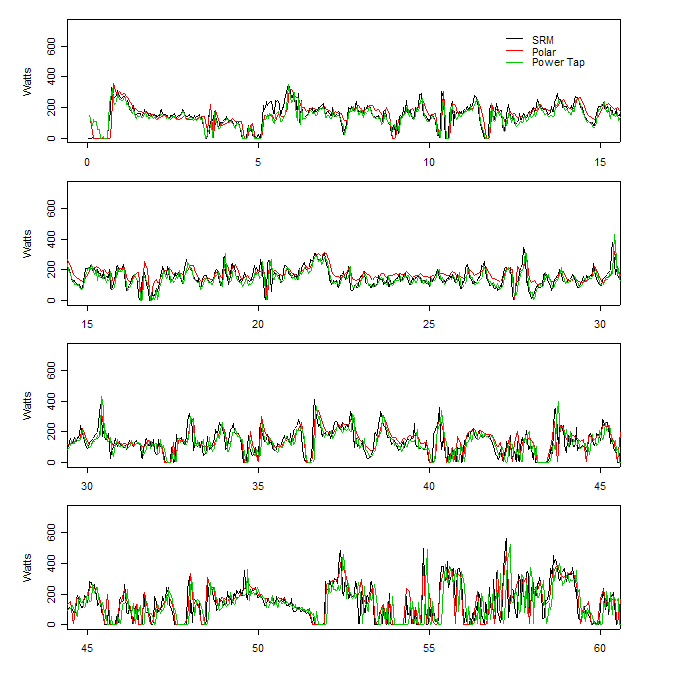
I have arbitrarily shown only the first 60 minutes of the ride (though I checked and the second hour looks pretty similar). In this graph, the horizontal axis is time in minutes, and I graph the unsmoothed data (when looking for differences, sometimes improper smoothing may remove too much of the interesting variability and is worse than looking at the unsmoothed data). I think you'll find that every major feature of the power profile is captured by each device. A close examination of the graph will also reveal that the zero wattage readings of the Polar often appear to occur in the same places as zero wattage readings for the Power Tap and SRM, but they will last for two observations or so--I hypothesize that either there is some threshold below which the Polar records a low wattage as zero, or else there is some inherent latency in the way that the Polar calculates wattage. An examination of the raw data seems to support this: compared to the SRM and the Power Tap, the Polar seems to have difficulty reading wattages below about 50 or 55 watts, and "drops" them down to zero. Only you can determine how important readings below 50 watts are to you. The Power Tap also has this characteristic (relative to the SRM) but to a lesser extent. If low but non-zero wattages are erroneously recorded as zero, it will affect the calculation of average power if that average excludes zero wattages (as does Polar's software).
Some readers will be satisfied with the overall comparison of wattage shown above, but others will want to see more detailed analysis. Those who wish to delve more deeply may click here, but I wouldn't particularly recommend it to the weak-of-heart or those who, unlike me, have already gotten a life. That page includes additional discussion of:
Previously I have posted data files of similar rides comparing the S710 and the Power Tap (see below) but this is the first publicly-available "Rosetta Stone" file that shows a ride with all three currently-available on-bike power-measuring devices. A zipped file containing the data and the analytical graphs is available here (about 240KB).
Notes on the data. The data are in ASCII comma-separated-value format. Once unzipped, most common spreadsheet programs can read this format without a problem. Adam weighed about 68 kg at the time of the ride. The SRM Amateur is normally mounted on Adam's bike; the Power Tap and Polar were mounted by Alan Coté, one of the co-developers of the power-sensing technology in the S710. The notes on the original file said that the Power Tap was a "Graber" unit (though it is unclear whether this is one of the newer Graber units or one of the older E-tune units) and had been "torque-zeroed" before the start of the ride. I'm not quite sure what this means. Adam had not checked the "calibration slope" of his SRM prior to this ride. According to a personal communication I received, the 2.52-second reporting interval does not report on the averages calculated over the preceding 2.52 seconds; rather, the underlying reporting interval is 1.26 seconds, and the 2.52-second reporting interval simply drops every other observation. I presume this is done to double the amount of data that can be recorded. I do not know whether the Polar or SRM behave similarly. The chain weight was incorrectly entered in the Polar so a post-hoc correction was made to deflate the nominal power; that correction factor was calculated to be about 0.6% (e.g., about 2 watts out of 300) and details are available if you're really interested in errors of that size. Because the SRM and Power Tap were started a couple of minutes ahead of the Polar, I have lopped off those minutes and re-synchronized the starts. In the original file I received, Alan had synchronized the wattage numbers but not the speed and cadence; I've corrected this myself so that speed, cadence, and power properly match. I've also converted speed measurements to kph and added a column to each file labeled, "g," which is an estimated gear ratio. Gear ratios are not reported by any of these devices--this is a calculated field that I added for those interested in examining power by gear. We all owe thanks to Adam Hodges Myerson and Alan Coté for their efforts in collecting and willingness to share these data.