Recently, the Ergomo bottom-bracket (about $1300US, www.ergomo-usa.com) has joined the SRM crank, the Power Tap hub, and the Polar chain-based system in the on-bike power measuring market. Although Ergomo dealers have done private testing and comparison of the new system, until now there has not been a publicly available data set that could be used for independent examination of how the Ergomo compares with any other power meter.
In August 2003, Hunter Allen undertook a hilly two-hour ride on a bike outfitted with both Power Tap Pro and Ergomo power meters. I have never used the Ergomo, so my analysis does not take into account ease-of-use, reliability, or features. It is limited to a comparison of wattage and other recorded data to those of the Power Tap. Elsewhere, I have examined the data collected during a ride on which three power meters were mounted on the same bike (a Power Tap, a SRM Amateur, and a Polar power unit).
Here is a tabular summary of the wattages recorded during the ride:
Mean of non-zero readings |
25%tile |
Median |
75%tile |
Maximum |
% zeros |
Normalized Watts |
|
Ergomo (5sec) |
221.7 |
112 |
216 |
279 |
895 |
9.4 |
250.9 |
Power Tap Pro (1.26sec) |
214.3 |
89 |
205 |
270 |
1027 |
11.1 |
242.7 |
The mean wattages are about 7 or 8 watts different, but the table also demonstrates that this difference extends across the entire power range, i.e., the difference isn't a percentage of the power but a constant amount. Normalized wattage is an alternative to mean wattage when power is variable. Note that the maximum wattage recorded by the Ergomo is much lower than that recorded by the Power Tap; this is because the Ergomo records power at 5-second intervals while the Power Tap Pro was set to record at 1.26 seconds.
A graph of the raw and unsmoothed wattage recorded during the first hour of the ride can be seen here:

The graphs above show that the wattage recorded by the Ergomo and the Power Tap Pro track each other well. However, some readers will be interested in seeing additional detail. In the graph below you will see the Power Tap wattage readings graphed against Ergomo wattage readings, with an added 45-degree line. Each dot tells you what the Power Tap and the Ergomo wattage was at any given instant. A dot below the 45-degree line indicates that the Power Tap recorded a wattage value higher than the Ergomo for the same moment; a dot above the line indicates the Ergomo recorded a value higher than the Power Tap. Most of the points lay very close to the diagonal, which means that they are close to the same recorded values. However, a close examination will show that slightly more points are above the line than below, meaning that the Ergomo tends to read slightly higher than the Power Tap.

Is there a particular pattern to this discrepancy? The plot below shows the difference between the two recorded wattages, with a red line superimposed on the dots to show the trend in the difference as power increases. Over most of the range of powers observed, that line is relatively flat, i.e., the difference is a constant offset rather than a percentage difference. There has been some supposition that the Ergomo's method of measuring net torque through the bottom bracket and then doubling it to get total torque would produce unreliable results. I do not know whether Hunter's left leg-right leg pedaling is exactly balanced but, if it weren't, a large discrepancy might be manifested as a line that either slants up or down with increasing power. These data were collected from only one rider on only one ride so they cannot be considered conclusive but it is reassuring that, in this particular case, systematic bias doesn't appear to be present.

What could explain the constant offset? One theory is that since the Ergomo measures power at the bottom bracket while the Power Tap measures it at the rear hub, the difference could be due in part to losses in the drive train. Drive train losses are often stated as a percentage, but there is some evidence that losses may be a constant amount, with about 5 watts being a suggested figure. If the difference in readings are due to drive train losses, and if drive train losses are (approximately) constant, then a large part of the 7 to 8 watt difference could be accounted for. However, it is premature to come to any conclusions based on a sample size of 1 ride and more data will need to be collected to determine which of these theories is better supported by the entirety of the evidence.
As has been noted elsewhere, the cadence function on the Power Tap is less consistent than other power meters. Perhaps this is of no interest to you -- many riders do not consider cadence to be particularly important. If you are among this group you can safely skip this section. However, if you are interested in cadence either on its own or because of its role in other analyses you may be interested in how the Ergomo compares. Below is a graph that shows the cadence over a 15-minute segment of the ride. With the introduction of the Pro model, Graber has given the rider the option to measure cadence either with a conventional magnet on the crank or in the way used by the original Power Tap, which imputed cadence from high-and-low spots in the torque curve. I do not know which of these two methods was used to measure the Power Tap cadence in the plot below. What you will be able to see from that plot is that the Ergomo recording of cadence is indeed very much smoother than that of the Power Tap Pro.

Of possible interest to some is the use of cadence data in other analysis. For example, it is well-known that given cadence, gear ratio, and wheel circumference one can calculate speed. With the data provided by the power meters, it is possible to back-calculate gear ratio given speed, cadence, and wheel circumference. Elsewhere I show that with good cadence information, it is possible to identify exactly which chainrings and cogwheels are mounted and being used. For another example, it is possible to calculate crank torque or pedal force given cadence and power, which may be of interest if you are interested in how one's power depends on how fast one pedals vs. how hard one pushes. The graph below shows one of these types of analyses: the calculated gear ratio for a five kilometer segment of the ride.
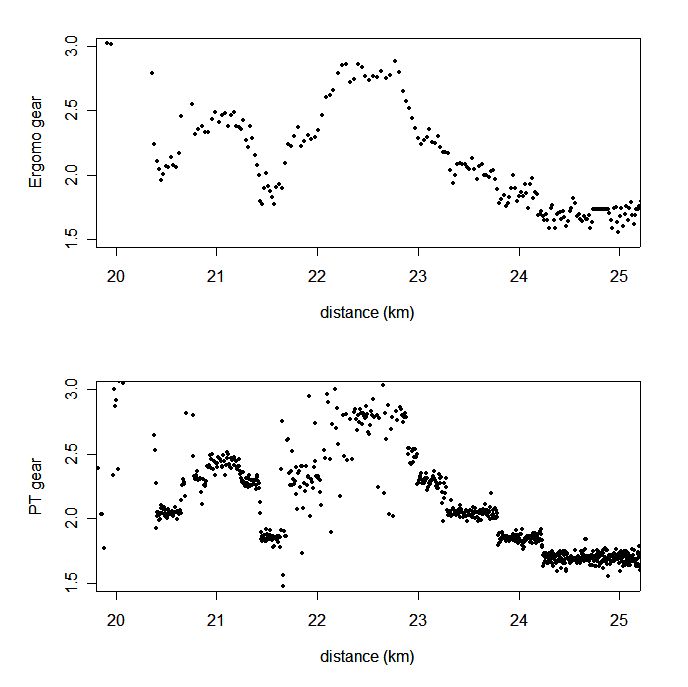
What is evident is that despite the variability in the Power Tap's cadence, it is still possible to spot the discrete "stairsteps" of separate gear ratios. In fact, the Ergomo's cadence has been smoothed too much to identify cleanly the points where gear shifts were made. In the three-way analysis of the Power Tap, the SRM, and the Polar, it was observed that the Power Tap's cadence was much less precise than the Polar's or the SRM's; the irony is that, with respect only to cadence recording, the Polar and SRM are to the Power Tap as the Power Tap is to the Ergomo.
In the graph below I show histograms of the cadence for the Power Tap and the Ergomo. As has been noted before, the Power Tap shows cadence heaps and cadence holes -- what is surprising is that the Ergomo cadence shows an even more extreme amount of heaping. Note that because the Power Tap was recording at 1.26-second intevals, one might expect a priori that the counts or frequencies of observations at any given level of cadence would be about 4 times larger for the Power Tap than for the Ergomo. This is clearly not the case.

The plot below is a detailed view of a segment of the Ergomo cadence histogram, with each bar labeled with its frequency. Note the high amount of heaping; an extreme example is that 54 rpm shows up in the data file almost 50 times more frequently than 53 rpm.

The Ergomo appears to produce wattage numbers quite consistent with that of the Power Tap. The Ergomo's cadence measurements appear to be over-smoothed, but this should matter only to those who are interested in further analysis of their data. This analysis does not compare features, usability, or reliability -- it only examines the quality of the power data. The evidence from this limited sample of data (i.e., 1 ride from 1 rider) is that consistency of power measurement doesn't appear to be an issue to worry about; a tentative conclusion might be that you should base a purchasing decision among power meters on features, usability, reliability, and price rather than on the method of measuring power.
The data on which this analysis is based are available on the Ergomo-USA website here. Make of its provenance what you will, but I could not find any similar publicly-available comparative data on the websites for the SRM, Power Tap or Polar. Thus, I thank (as should we all) Hunter Allen and Ergomo-USA for sharing these data. The data are in binary format; you must have access to Cycling Peaks Software (or its privately-labeled version supplied with the Ergomo) in order to convert the data to a format readable by spreadsheets or other statistical programs. Apparently, the wheel circumference settings for the Ergomo and Power Tap were not identically set for this ride since both the speed and distance were off by consistent amounts. Neither the Ergomo nor the Power Tap rely on wheel circumference for their wattage calculations, so this does not affect the accuracy of the comparison. The Ergomo appears to "shut itself down" sooner than the Power Tap when one stops for a break; since Hunter stopped for about three minutes in the middle of his ride, there is a small time gap in the Ergomo data during which the Power Tap data were either blank or zeros (you can see this at around 81 to 84 minutes into the ride in the second hour's plot). I excluded this segment when calculating the "non-zero mean wattage" and the "percent of measurements with zero power," i.e., my calculations only take into account the time when the wheels are turning, not for the entire elapsed time of the ride. If you try to double-check my findings, please keep these things in mind. People who read all the way to the end of the fine print worry me. Go out and ride. No one from Ergomo or Power Tap had any hand in my analysis and all conclusions, interpretations, and errors are mine alone.